
IVAN Air Monitoring
Poor air quality can harm your health. Take action to reduce your exposure to air pollutants. Use the list or map to view current air quality levels at your nearest air monitor. Sign up to receive alerts when the air quality near you is unhealthy, or get notifications on this device without an account. Scroll down to learn more.
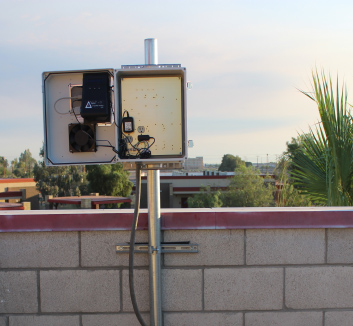
List of Monitors
View a list of air monitors located around Sonoma County
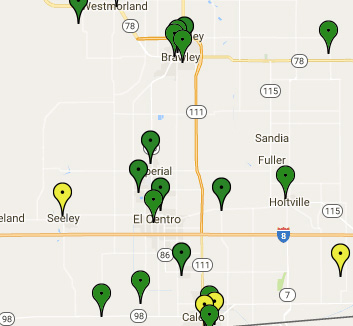
Map of Monitors
View an interactive map of the air monitors
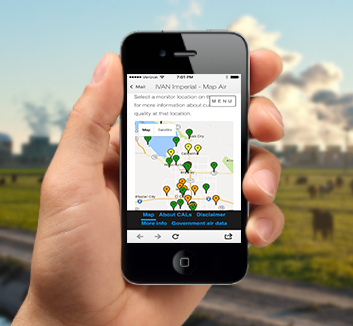
Get Air Quality Alerts
Sign up to get alerts when the air quality near you is unhealthy
About the network
IVAN Air Monitoring is a network of community air monitors located throughout Sonoma County. These monitors measure current levels of particulate matter air pollution (PM2.5 and PM10). The air quality measurements are displayed on this website.
This network was developed in response to community residents’ concerns about air quality and their desire for more neighborhood-level data.
About CALs
Community Air-Quality Levels (CALs) are used to describe air quality in terms of how harmful the level of particulate matter (PM) pollution in the air is to human health. The CALs are derived using similar methods as EPA’s Air Quality Index (AQI).
You should use both IVAN Air Monitoring and government air data to understand the air quality levels around you. When comparing health recommendations from both sources, you should follow the most health protective recommendation.
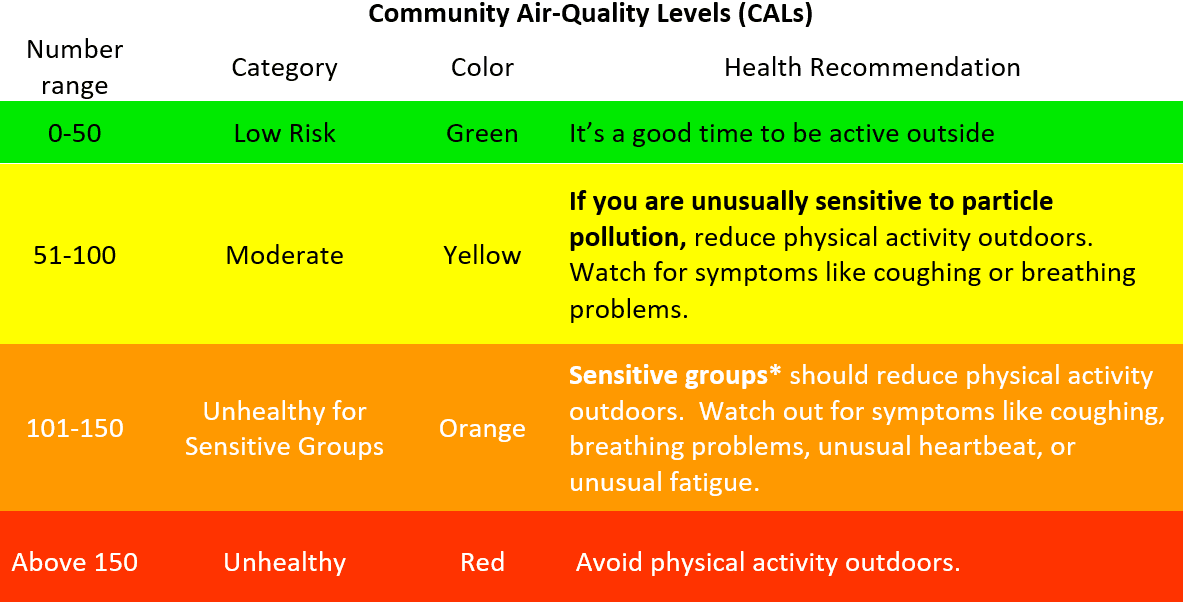
*Sensitive groups include children, teens, older adults, pregnant women, and people with heart, lung, or other chronic diseases
Air Quality Index (AQI) Basics
What is the U.S. Air Quality Index (AQI)?
The U.S. AQI is EPA's index for reporting air quality.
How does the AQI work?
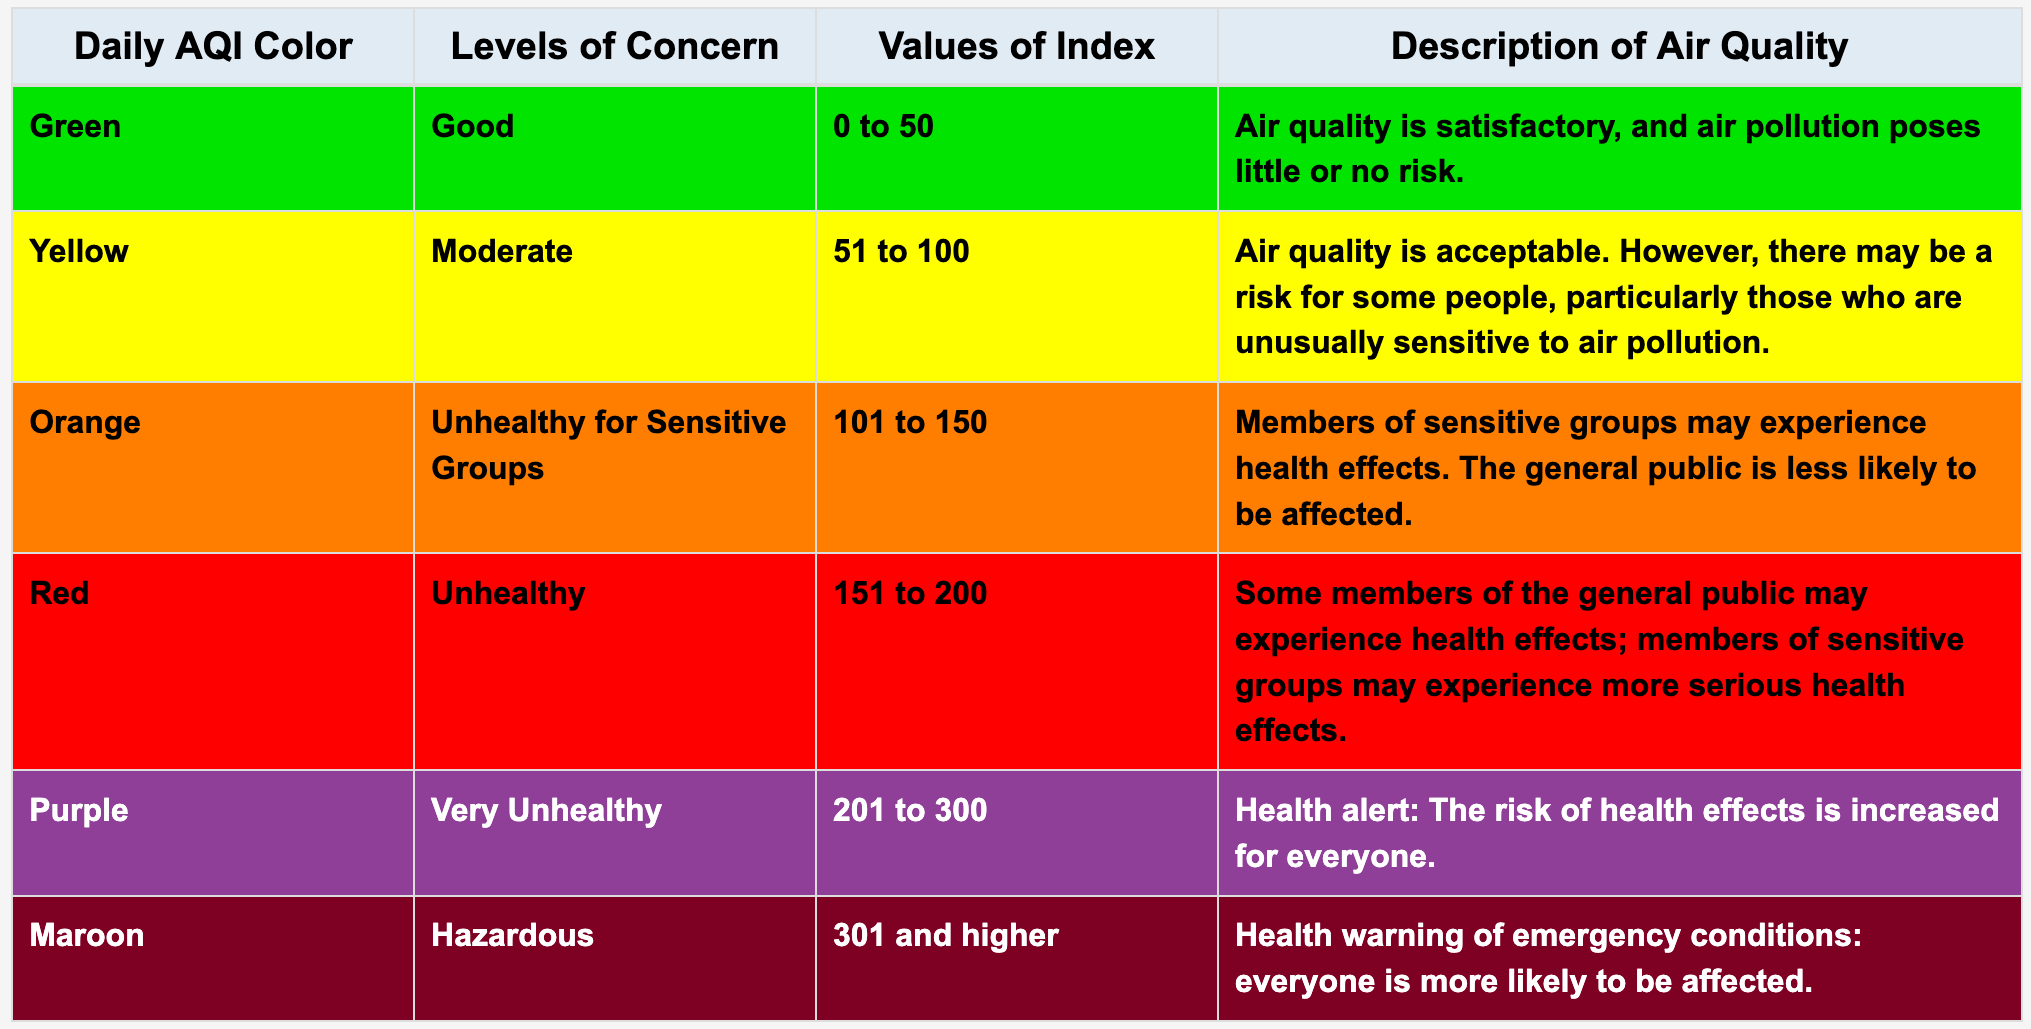
The U.S. Air Quality Index (AQI) is EPA's tool for communicating about outdoor air quality and health. The AQI includes six color-coded categories, each corresponding to a range of index values. The higher the AQI value, the greater the level of air pollution and the greater the health concern. For example, an AQI value of 50 or below represents good air quality, while an AQI value over 300 represents hazardous air quality.
For each pollutant an AQI value of 100 generally corresponds to an ambient air concentration that equals the level of the short-term national ambient air quality standard for protection of public health. AQI values at or below 100 are generally thought of as satisfactory. When AQI values are above 100, air quality is unhealthy: at first for certain sensitive groups of people, then for everyone as AQI values get higher.
The AQI is divided into six categories. Each category corresponds to a different level of health concern. Each category also has a specific color. The color makes it easy for people to quickly determine whether air quality is reaching unhealthy levels in their communities.
AQI Basics for Ozone and Particle Pollution
Disclaimer
When using this information, please note the following:
- In order to provide air quality information in real time, the data presented on this website are not validated or verified
- The air quality levels are for particulate matter (PM) only. Other air pollutants, such as ozone, may be present, even when PM levels are low.
- These data do not come from regulatory monitors and cannot be used to infer violations of the law
- Data on this website should be considered preliminary and used with discretion
Learn more about our monitor validation process, how to use the data on this website, and how to compare the data with government